

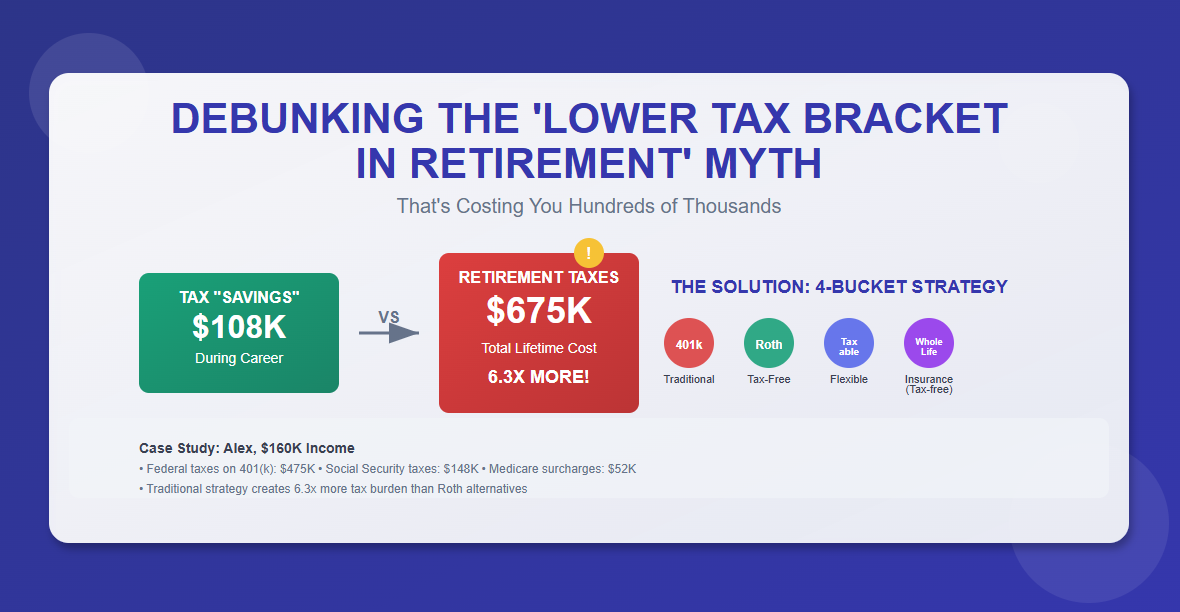
Picture this scenario: You diligently save for retirement, maximize your 401(k) contributions, and feel great about the tax deductions you receive each year. Fast forward 30 years, and you discover that every dollar you “saved” in taxes actually cost you 6 dollars in retirement. Sound impossible? The mathematics behind this reveal one of the most misunderstood aspects of retirement planning.
The Foundation: Tax-Deferred vs. Tax-Free Growth
The government offers 2 payment plans for your retirement taxes:
| Option | Account Type | How It Works |
|---|---|---|
| Option A | Traditional 401(k) / IRA | Pay taxes later on everything you withdraw — including all the growth your money earned over decades |
| Option B | Roth 401(k) / IRA | Pay taxes now only on what you contribute, then never pay taxes again on that money or its growth |
Most people instinctively choose Option A because the immediate tax break feels tangible. But this decision requires a critical assumption: that you’ll pay less in total taxes during retirement than you save during your working years. That assumption is usually wrong.
Meet Alex: A Case Study in Retirement Tax Planning
Alex represents many professionals today — someone who earns a solid living and diligently saves for retirement.
| Parameter | Value |
|---|---|
| Annual income | $160,000 |
| Current marginal tax bracket | 24% |
| Annual 401(k) contribution | $18,000 |
| Expected investment return | 7% annually |
| Years until retirement | 25 |
| Expected years in retirement | 25 |
Alex chooses traditional 401(k) contributions because the immediate tax savings feel tangible and beneficial. Here is what that decision actually costs over a lifetime.
Phase 1: The Accumulation Years (The Visible Savings)
The math during Alex’s working years appears straightforward and favorable.
Annual tax savings calculation:
- Contribution: $18,000
- Marginal rate: 24%
- Annual tax savings: $18,000 x 24% = $4,320
25-year accumulation summary:
| Metric | Amount |
|---|---|
| Total contributions | $450,000 |
| Total tax savings | $108,000 |
| Account value at retirement (7% growth) | $1,822,470 |
This seems like an excellent deal. Alex has saved $108,000 in taxes while building a substantial nest egg. The problems emerge in the next 3 phases.
Phase 2: The Distribution Years (The Hidden Costs)
Every dollar withdrawn from the traditional 401(k) becomes ordinary taxable income. Alex follows the commonly recommended 4% withdrawal rule, adjusted annually for inflation at 2.5%.
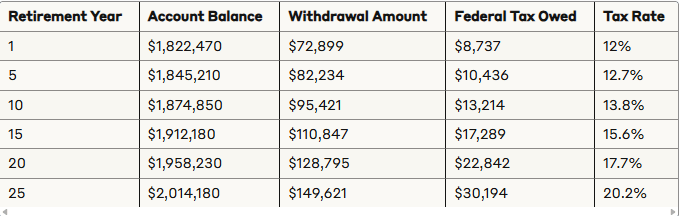
Notice how the effective tax rate increases from 12% to over 20% as withdrawal amounts grow with inflation adjustments.
Total taxes paid on retirement distributions over 25 years: $475,230
Alex will pay more than 4 times as much in taxes during retirement ($475,230) as was saved during the working years ($108,000). And this is only Phase 2 of 4.
Phase 3: The Social Security Tax Multiplier
Social Security benefits can become taxable based on what the IRS calls “provisional income.”
Provisional Income Formula: Adjusted Gross Income + Non-taxable Interest + 50% of Social Security Benefits
Social Security Taxation Thresholds
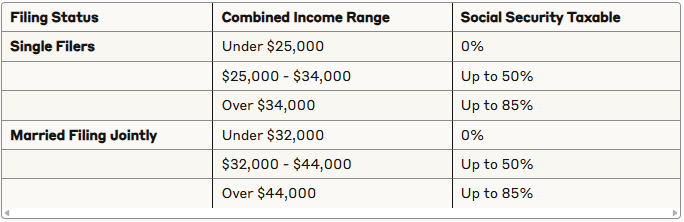
Critical detail: These thresholds haven’t been adjusted for inflation since 1993. They are far easier to exceed than most people realize.
Alex’s Year 1 provisional income calculation (single filer, $36,000 Social Security benefit):
| Component | Amount |
|---|---|
| Traditional 401(k) withdrawal | $72,899 |
| 50% of Social Security | $18,000 |
| Combined (provisional) income | $90,899 |
Since this far exceeds the $34,000 threshold, up to 85% of Alex’s Social Security becomes taxable.
The Compounding Effect Over Time
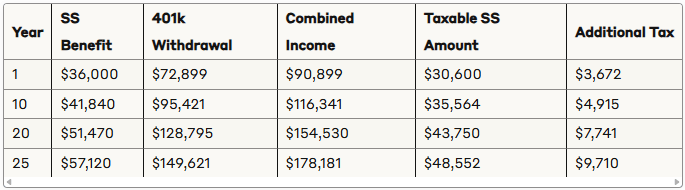
The “Additional Tax” column shows the yearly cost of having retirement account withdrawals push Social Security benefits into taxable territory.
Total additional taxes on Social Security over 25 years: $147,890
Phase 4: The Medicare Premium Penalty — The “Stealth Tax”
The final layer of hidden costs comes through Medicare’s Income-Related Monthly Adjustment Amount (IRMAA). This doesn’t look like a tax — it appears as a higher insurance premium. But it functions exactly like one.
What Is IRMAA?
IRMAA (Income-Related Monthly Adjustment Amount) requires higher-income Medicare enrollees to pay more for both Part B (medical insurance) and Part D (prescription drug coverage). Surcharges are calculated based on income from 2 years prior.
Why 401(k) withdrawals trigger IRMAA:
- Traditional 401(k) withdrawals count as ordinary income
- Higher withdrawals = higher reported income
- Higher income = higher Medicare premiums
- These surcharges continue as long as income stays elevated
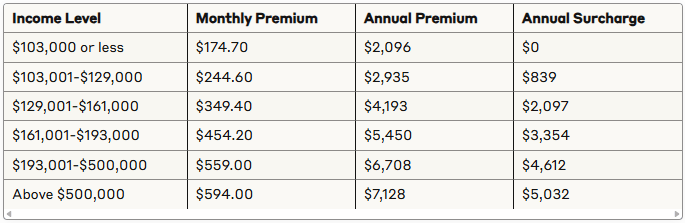
2024 Medicare Part B Premium Structure (Single Filers)
2024 Medicare Part D Premium Structure (Single Filers)
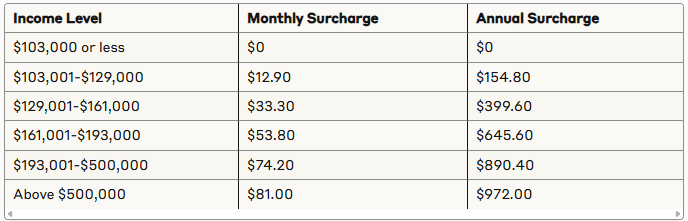
Together, Part B and Part D surcharges create a combined “stealth tax” on retirement income that most people never anticipate when they make their 401(k) contribution decisions in their 30s and 40s.
IRMAA Impact Analysis for Alex
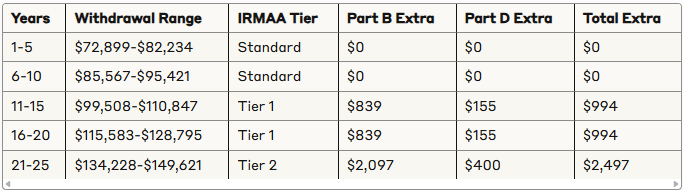
IRMAA tier summary:
| Tier | Income Range | Part B Annual | Part D Surcharge | Total Extra |
|---|---|---|---|---|
| Standard | Under $103,000 | $2,096 | $0 | $0 |
| Tier 1 | $103,001 to $129,000 | $2,935 (+$839) | +$155 | $994/yr |
| Tier 2 | $129,001 to $161,000 | $4,193 (+$2,097) | +$400 | $2,497/yr |
Alex’s 25-year IRMAA timeline:
| Period | Tier | Cost |
|---|---|---|
| Years 1 through 10 | Standard | $0 |
| Years 11 through 20 | Tier 1 | $9,940 |
| Years 21 through 25 | Tier 2 | $12,485 |
| Total additional Medicare costs | $22,425 |
3 Reasons IRMAA Is Particularly Costly
The two-year lag problem: Medicare uses income from 2 years ago to set this year’s premiums. You can’t adjust mid-year to reduce surcharges, and large withdrawal years impact you for multiple years.
The cliff effect problem: IRMAA brackets create sharp jumps. Earning $129,000 vs. $129,001 costs an extra $1,458 annually. A single dollar of additional income can trigger hundreds in additional premiums.
The compounding problem: Unlike regular income taxes, IRMAA surcharges recur every month for as long as income stays elevated. Traditional 401(k) withdrawals essentially guarantee elevated income throughout retirement.
Note: IRMAA brackets and amounts are updated annually. These calculations use 2024 figures.
The Complete Financial Picture
Summary: All Tax-Related Costs Across Alex’s Lifetime
| Component | Amount |
|---|---|
| Working-years tax savings | $108,000 |
| Retirement income taxes | $475,230 |
| Social Security taxes | $147,890 |
| Medicare IRMAA surcharges | $22,425 |
| Total retirement taxes and penalties | $675,560 |
| Ratio: retirement costs vs. working-year savings | 6.3 to 1 |
Alex saved $108,000 in taxes to ultimately pay $675,560 in retirement-related taxes and penalties. That is 6.3 times more than the original tax savings.
The Roth Alternative
If Alex had chosen Roth 401(k) contributions instead, the $108,000 in taxes would have been paid upfront. In exchange:
- All withdrawals are tax-free
- Roth distributions don’t count toward provisional income — Social Security taxation is unaffected
- Roth distributions don’t affect IRMAA calculations
- No required minimum distributions (RMDs) at age 73
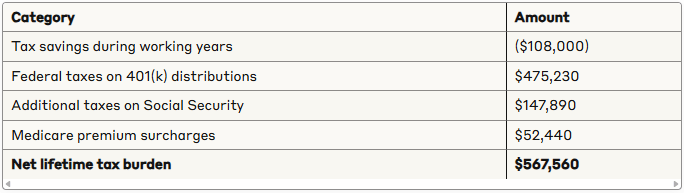
Net tax savings with Roth strategy vs. traditional: $567,560
Beyond Traditional and Roth: Whole Life Insurance as a Tax-Advantaged Vehicle
Properly structured whole life insurance can serve as a sophisticated tax-advantaged retirement savings vehicle. Here is how it works and where it fits.
How Whole Life Insurance Works for Retirement
A whole life policy has 2 components: a death benefit (the insurance protection) and a cash value account (the savings component). Cash value grows through premium payments and dividends, creating a pool of money you can access during your lifetime.
Tax advantages:
| Feature | How It Works |
|---|---|
| Tax-advantaged growth | Cash value grows without current taxation — similar to a 401(k) or IRA |
| Tax-free access | Policy loans and partial withdrawals don’t create taxable income — similar to Roth distributions |
| No RMDs | No mandatory withdrawals at age 73 |
| Tax-free death benefit | Beneficiaries receive the remaining death benefit income-tax-free |
| No contribution limits | Unlike 401(k)s and IRAs, no annual caps — valuable for high earners who want to save beyond traditional limits |
Alex’s Integrated Strategy
Assume Alex allocates $8,000 annually to a whole life policy designed for cash value accumulation, while contributing $10,000 to the traditional 401(k).
Modified allocation:
| Bucket | Annual Amount |
|---|---|
| Traditional 401(k) | $10,000 |
| Whole life insurance premium | $8,000 |
| Combined annual savings | $18,000 |
Whole Life Cash Value Projection (4.5% Conservative IRR)
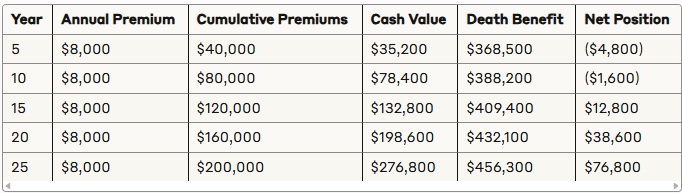
Notice how the policy becomes profitable after year 10, with the “Net Position” showing when cash value exceeds total premiums paid.
By retirement: approximately $276,800 in accessible cash value, funded by $200,000 in premiums over 25 years.
Tax-Free Retirement Income Through Policy Loans
Instead of taking taxable withdrawals, Alex borrows against the policy’s cash value. Policy loans are not considered taxable income — you’re borrowing your own money using the policy as collateral.
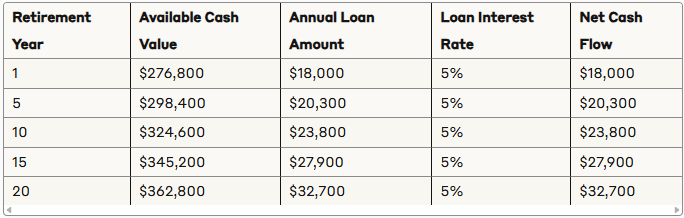
The “Net Cash Flow” represents spendable income that doesn’t count toward Social Security taxation or Medicare IRMAA calculations.
Key loan features:
- The policy continues earning dividends on the full cash value while loans are outstanding
- No mandatory repayment schedule
- Outstanding loan balances at death are deducted from the death benefit paid to beneficiaries
- Many policies offer “wash loans” where the dividend rate equals the loan rate
Limitations to understand:
- Higher fees than Roth accounts, especially in early years — best maintained long term
- MEC (Modified Endowment Contract) rules apply: overfunding a policy eliminates tax advantages, so proper design is critical
- Requires knowledgeable professionals to structure correctly
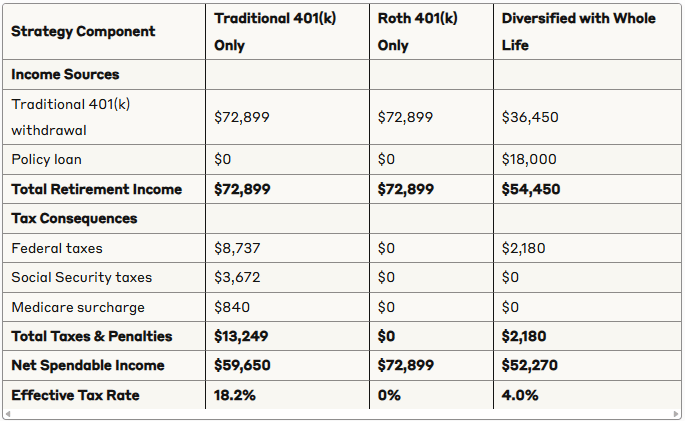
Comparing All 3 Strategies: Year 1 Retirement
| Strategy | Key Tax Outcome | Social Security Impact | IRMAA Impact |
|---|---|---|---|
| Traditional 401(k) | 18.2% effective rate — highest | Up to 85% taxable | Surcharges triggered above $103,000 |
| Roth 401(k) | 0% on withdrawals | No impact | No impact |
| Diversified (traditional + whole life) | Lower total income, significantly reduced tax burden | Reduced impact | Reduced or eliminated surcharges |
While the diversified strategy produces lower total income, it creates strategic advantages: flexibility for future tax planning, no market risk on cash value, and preserved death benefit for legacy.
The Four-Bucket Retirement Strategy
When properly integrated, whole life insurance creates a 4th bucket in your retirement tax diversification strategy:
| Bucket | Account Type | Primary Purpose |
|---|---|---|
| 1 | Traditional accounts | Immediate tax relief during peak earning years |
| 2 | Roth accounts | Tax-free growth and distributions |
| 3 | Taxable accounts | Liquidity and flexibility |
| 4 | Whole life insurance | Tax-advantaged income that doesn’t affect Social Security or Medicare calculations |
This approach provides maximum flexibility to manage your effective tax rate throughout retirement by choosing which bucket to draw from each year.
Real-World Implementation: The Phased Approach
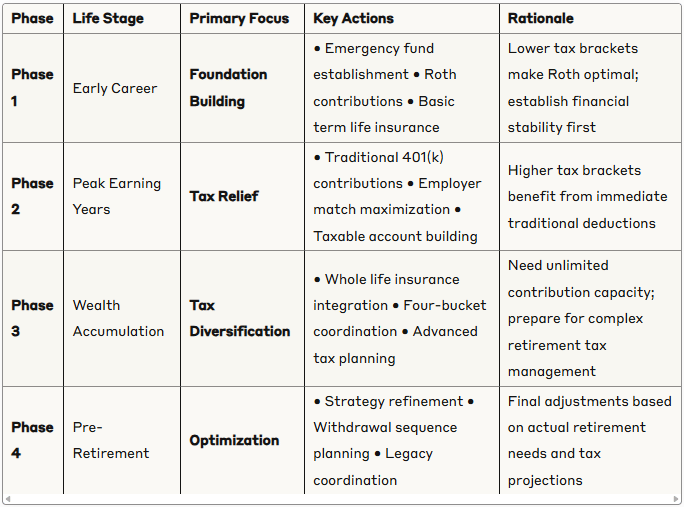
Phase 1: Foundation Stage — Early Career (20s through 30s)
- Step 1: Establish a 3 to 6 month emergency fund before implementing any retirement tax strategy
- Step 2: Prioritize Roth contributions — lower tax brackets in early career make Roth exceptionally valuable; every dollar contributed in your 20s has 30+ years of tax-free growth
- Step 3: Build taxable investment accounts once Roth contribution space is maximized; these provide liquidity and serve as bucket 3
- Step 4: Term life insurance if you have dependents; avoid permanent life insurance until income stabilizes
Phase 2: Building Stage — Mid-Career (40s through 50s)
- Split contributions between traditional and Roth based on current bracket and retirement projections
- At 24% bracket or higher, traditional contributions provide meaningful immediate relief while Roth maintains diversification
- Maximize employer-sponsored plan contributions, especially with matching
- Begin expanding taxable accounts systematically
- Introduce whole life insurance as a tax diversification tool once income has stabilized and long-term needs are clearer
Phase 3: Optimization Stage — Peak Earning Years (50s through 60s)
- Whole life insurance becomes particularly valuable for high earners who have maxed out 401(k) and IRA limits
- Actively manage all 4 buckets based on annual tax situation
- Begin modeling different withdrawal strategies to understand how the four-bucket approach will work in practice
- Coordinate whole life insurance strategy with estate planning goals
Phase 4: Transition and Distribution Stages (Pre-retirement and Beyond)
Roth conversion opportunities: If you retire before claiming Social Security, the gap years are an ideal window for Roth conversions at temporarily reduced rates.
Dynamic withdrawal sequencing: Rather than following rigid rules, optimize income sources year by year:
- Bear market protocol: Prioritize withdrawals from stable value sources (whole life cash value, bonds) — allow equities in retirement accounts to recover
- Bull market protocol: Consider larger traditional account withdrawals for Roth conversions while rates are known
Social Security and Medicare coordination: Roth withdrawals and whole life policy loans don’t count toward provisional income or IRMAA income calculations — use them strategically to stay below surcharge thresholds.
Modified 4-bucket allocation (Alex’s balanced approach):
| Bucket | Annual Allocation |
|---|---|
| Traditional 401(k) | $10,000 |
| Roth 401(k) | $4,000 |
| Whole life insurance | $8,000 |
| Taxable savings | $2,000 |
Retirement income sequencing:
- Draw first from taxable accounts for lower capital gains rates
- Use policy loans to supplement income without triggering taxes
- Take traditional 401(k) withdrawals up to lower tax bracket thresholds
- Preserve Roth accounts for later years or legacy planning
When Traditional Accounts Still Make Sense
Despite this analysis, traditional contributions aren’t always wrong. 3 scenarios where they make sense:
Early retirement with a low-income bridge period: If you retire early and have several years of low income before Social Security and RMDs begin, traditional accounts can produce tax-efficient withdrawals during those years.
Very high current bracket with planned lower retirement spending: If you’re in the 32% or 35% bracket today and plan to live on significantly less in retirement, the traditional approach might still produce a net benefit.
Tax bracket management in retirement: Having both traditional and Roth accounts provides flexibility to fill specific tax brackets each year in retirement.
The Psychology Behind the Traditional 401(k) Trap
Present bias: The immediate $4,320 tax refund today feels more real than $27,000 in taxes paid 25 years from now.
Complexity aversion: The calculation we just performed requires understanding multiple tax systems and their interactions. Most people understandably prefer the simpler narrative of “save taxes now, pay less later.”
The lower bracket myth: Many assume they’ll be in a lower bracket in retirement because their salary stops. Successful retirement planning often maintains or even increases income through Social Security, RMDs, investment income, and part-time work — keeping effective brackets high or higher than expected.
The Bottom Line
Alex saved $108,000 in taxes to ultimately pay $675,560 in retirement-related taxes and penalties. That is not a coincidence or an edge case — it is the predictable outcome of deferring taxes on a growing asset.
Consider this: would you rather pay income tax on the seed or the harvest? When that seed grows into a tree producing fruit for decades, the harvest becomes substantially larger than the original seed. The same principle applies to retirement savings.
The goal of retirement planning isn’t to minimize taxes today — it’s to maximize after-tax income when you need it most: during retirement.
This article is for educational and informational purposes only and should not be considered personalized financial, tax, or investment advice. Tax laws are complex and subject to change, and individual circumstances vary significantly. The examples and calculations are hypothetical and may not reflect actual investment returns, tax rates, or personal situations. Before making any financial decisions, consult with qualified financial advisors, tax professionals, and/or estate planning attorneys. Social Security, Medicare, and tax regulations are subject to change by Congress and may differ from the assumptions used in this analysis.